
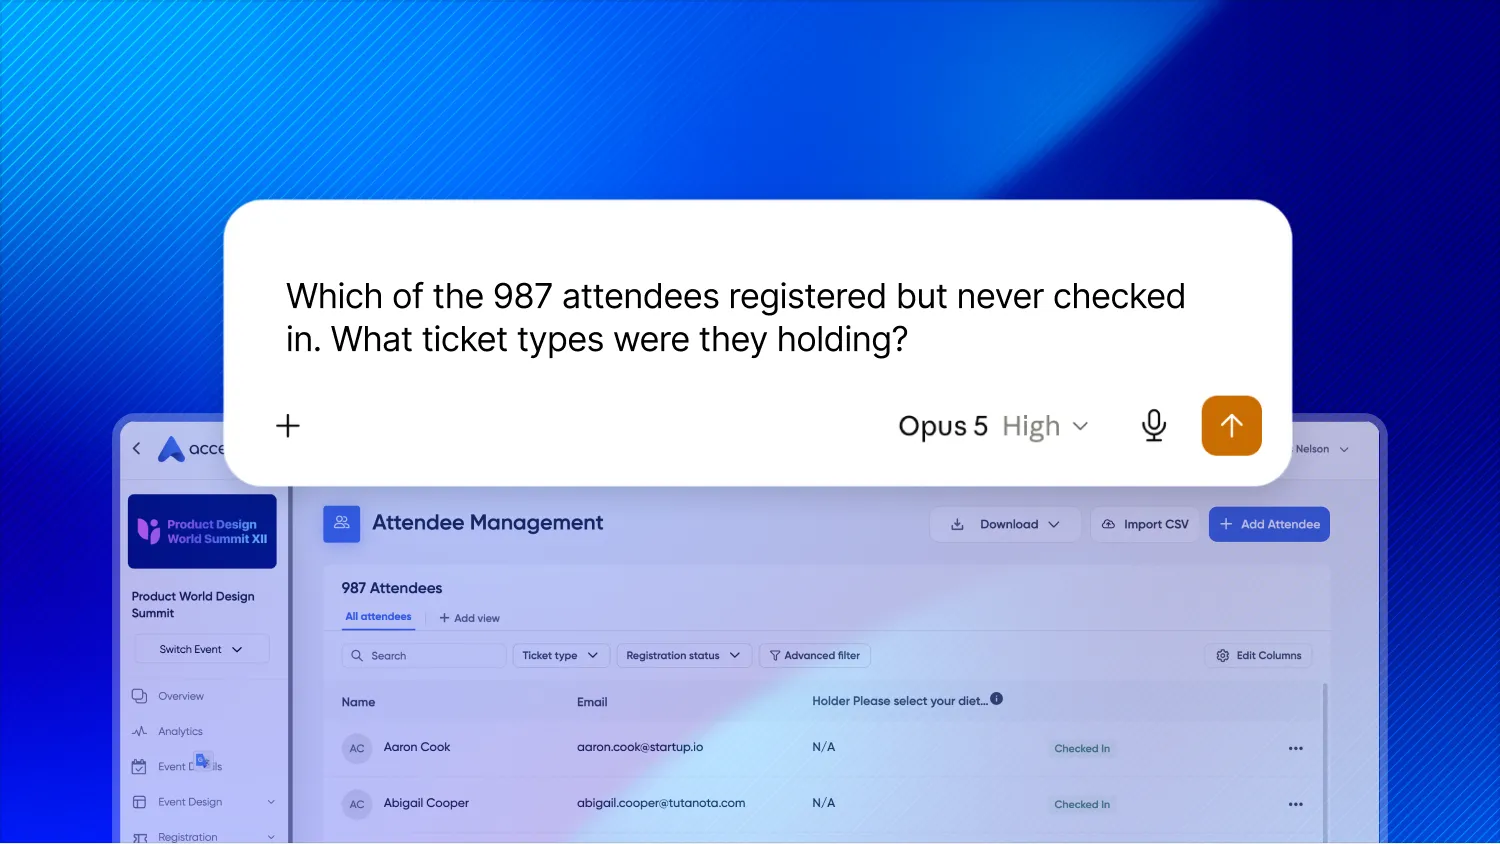
Your event platform already has more answers than your dashboard can show you. An MCP connector makes it much easier to use AI to access, analyze, and act on your event data.
The week after your annual conference, a senior executive will inevitably ask “what was our ROI on that event?”
You'll have numbers: registrations, attendance, session ratings, sponsor engagement, maybe a slide full of quotes from the closing keynote. Every number will be true, and there's a decent chance none of them will answer what leadership actually wants to know:
We spent what we spent. What did we get from it, and should we do it again?
The frustrating part is that much of the event data you'd need to answer that question already exists. It's just not necessarily in your CRM dashboard.
Ask your event platform how many people registered, and you'll have the answer in seconds. Ask which sessions people registered for and then skipped, what net revenue looks like after refunds, whether your premium sponsors actually outperformed standard sponsors, or which ticket types are closest to selling out, and you've probably entered a very different world.
Exports. Spreadsheets. Pivot tables. Maybe a favor from Nick in RevOps.
The problem isn't that event teams don't have enough data. It's that getting from event data to an answer has required too much work.
That's what makes using AI for event data analysis interesting.
An MCP connector lets a AI tools like Claude work directly with the data inside your event management platform. Instead of navigating reports based on questions someone anticipated when the software was built, you can start with your own question and let AI find and summarize the relevant data. The connector also lets you join your event data with the data in your CRM or marketing automation platform, providing more robust insights.
Accelevents’ MCP connector, for example, can give Claude read access to data across registrations, ticket sales, orders, attendees, sessions, sponsors, exhibitors, reporting, and more.
That changes more than reporting. It changes what event teams can reasonably expect to know and turns data into actionable insights.

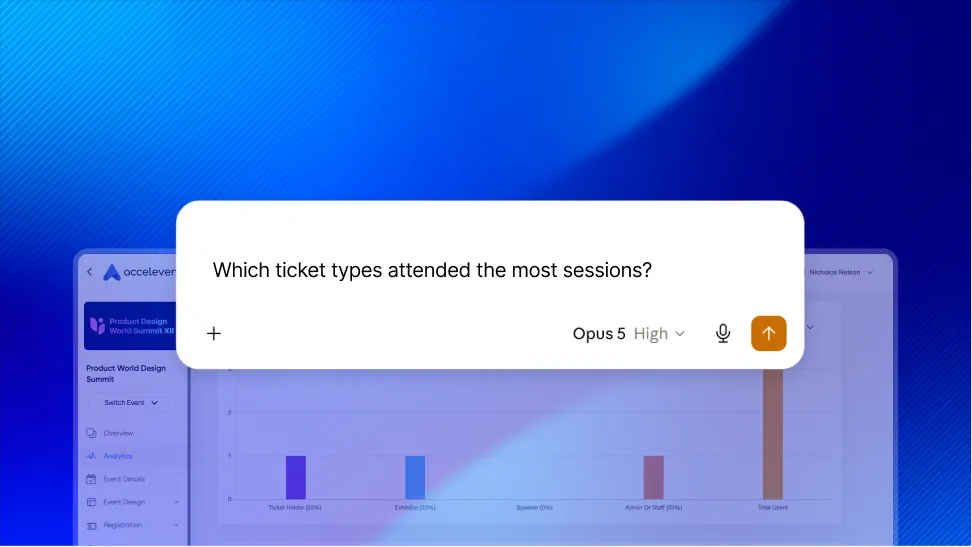
How AI changes the questions you can ask about your event data
Traditional event reporting works largely by deciding in advance what people will want to know.
Registrations by source. Count of ticket type sold. Attendance. Revenue. Session popularity. Check-in numbers.
Those dashboards are useful. They're also inherently limited. Someone had to decide which metrics deserved a chart, which filters to include, and which relationships between the data were worth building into a report.
The question you need to answer for your CMO on Tuesday afternoon may not be one anyone anticipated six months ago when that dashboard was built.
Maybe Finance wants to know how much revenue remains tied up in unpaid or partially paid orders.
Maybe your partnerships lead wants to understand whether exhibitors with larger booths actually generated more leads.
Maybe you're already planning the next agenda and want to compare session registrations with check-ins to see where interest turned into attendance (and where it didn't).
Historically, you could answer each of those questions. The issue was the amount of work separating the question from the answer.
An MCP connector lowers that hurdle.
Instead of starting with ‘Which report should I run?’ you can ask ‘What am I trying to understand?’
Start using AI with the event questions that take more time than you have to answer
The most useful first application of AI to event data probably isn't a brilliant strategic insight. It's the tedious question you've been meaning to answer and haven't had time to investigate.
Take revenue reconciliation.
Event dashboards are great at telling you how many tickets you've sold and how much revenue you've generated. They're not always where you'd naturally go to investigate leakage, exceptions, refunds, duplicate registrations, or outstanding payments.
Those questions tend to be a maze you would love to avoid:
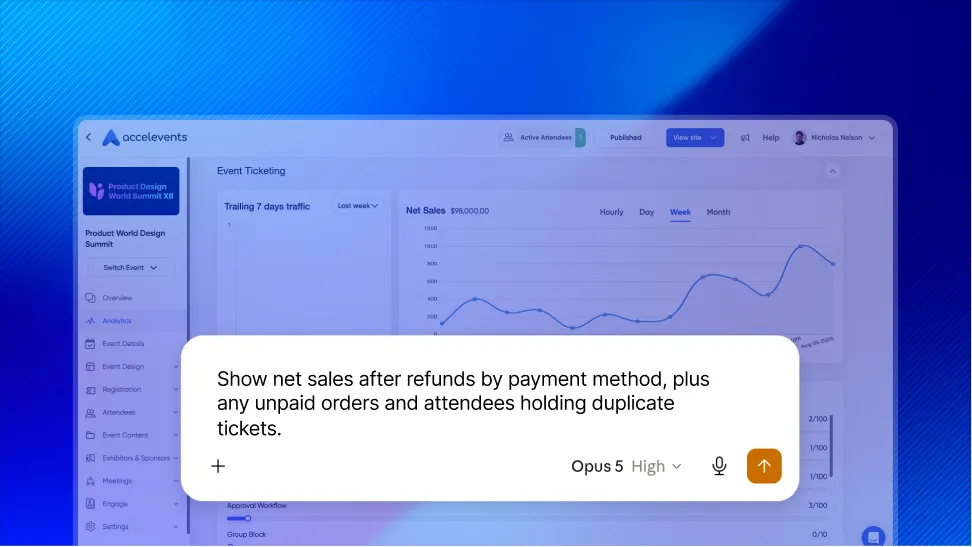
How many orders are still unpaid or partially paid, and who are the buyers?
Are any attendees holding duplicate tickets?
What is net revenue after refunds across every payment method?
How many attendees purchased add-ons?
How many used a discount code, and which ones?
With direct AI access to your event data, those become questions you can simply ask. Accelevents' MCP connector can retrieve revenue summaries after refunds, order-level payment and refund histories, ticket availability, attendee records, and CSV report exports.
None of this is particularly glamorous, but it all adds up.
That's an important part of AI's value proposition for event management. Not every use case needs to transform your strategy. Sometimes eliminating two hours of reconciliation work is valuable enough.
Use AI to find relationships across your event data
The bigger opportunity comes when you stop asking for individual event metrics and start asking about the relationships between them. That is a perfect use case for AI.
Sponsor and exhibitor performance is a good example.
Most event teams can quickly report total attendance, booth traffic, or leads captured. But sponsors aren't really buying those numbers. They're buying access, engagement, visibility, and ultimately some kind of business value.
That creates much more useful questions:
Which sponsor tier generated the most engagement?
Are premium placements actually outperforming standard ones?
Which exhibitors captured the most leads, and how does that compare with booth size?
Where did booth visitors come from?
Those questions become much easier to answer when your event management platform actually models sponsors, exhibitors, booths, leads, placements, and engagement as usable data. Accelevents can return sponsor tiers and placements, exhibitor categories and booth sizes, lead counts, booth visitors, traffic sources, and broader expo engagement data through the connector.
Suddenly the data isn't just helping you produce a sponsor recap. It is helping you reimagine next year's packages, pricing, placements, and floor plan.
If premium placement consistently generates no more engagement than standard placement, you have a pricing or placement question to answer. If larger booths aren't producing more leads, that tells you something too.
Those decisions are hiding in event data you may already have.
Use historical event data to plan your next event
The same applies to programming and capacity planning.
Event teams make dozens of consequential decisions about room assignments, agenda structure, session timing, speakers, and capacity. Yet many of those decisions still rely on experience and tribal knowledge.
Your historical event data can serve as additional input, as long as the event and its data are still available on your event platform.
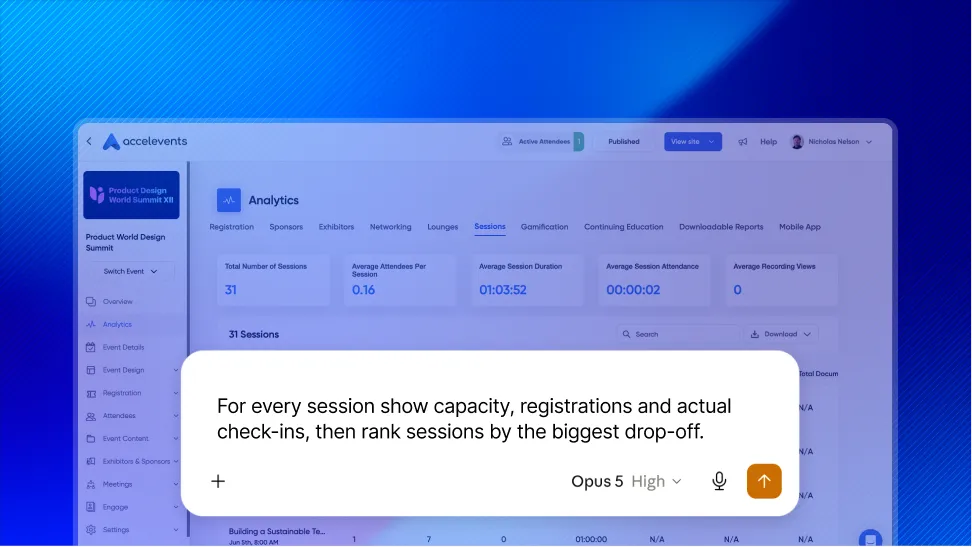
Imagine asking AI to show you every session from last year's conference with its capacity, number of registrations, and actual check-ins.
A session with 300 registrations and 290 attendees tells you one thing.
A session with 300 registrations and 90 attendees tells a very different story.
The second session didn't necessarily have a demand problem. The title may have worked beautifully. But maybe it competed with a more popular session, was scheduled at an off time, or attracted people who ultimately weren’t the right fit.
You can also look at which sessions attracted the most registrations, which ones approached capacity, and which rooms or locations were used most often. Accelevents exposes per-session registration counts, session capacity, registered and checked-in counts, plus room and location usage data.
That doesn't mean AI should build your agenda for you. It means the person building the agenda can make decisions with more evidence and less guesswork.
Better AI event analysis starts with better data collection
Here's where the conversation about AI and event data gets more interesting. Once asking questions becomes easy, the quality of the data you've collected becomes much more important.
Ask your AI tool to tell you the seniority mix of your attendees. Do you collect job titles?
Ask which industries are most represented. Do you collect industry, or another field that reliably tells you?
Ask what attendees most want to learn at your event. Did you include that open field?
No AI connector can retroactively create information you never captured.
AI can sometimes infer things from the information available to it, but inference isn't the same as intentionally collecting the data you'll use to make an important decision. If knowing an attendee's role, organization, interests, or objectives will change how you design or evaluate your event, you have to plan to capture that information well before the event.
That reframes registration-form design.
It's easy to treat registration fields as an operational task: What information do we need to process this attendee?
This is the lottery-winning question: What will we want to understand about this audience later?
Every field you collect creates another dimension you can analyze. Every field you don't collect limits the questions you can answer.
Of course, you absolutely cannot have a 40-question registration form. A form that takes ten minutes to complete is just wrong. The art is identifying the two or three pieces of information whose answers could change a decision and eliminating fields that exist simply because… “we’ve always asked attendees this.”
AI makes event data analysis easier. It doesn't make data strategy irrelevant.
If anything, it makes it more important.
What an MCP connector can and can't do with event data
With any new AI capability, there's a tendency to quickly jump from "this makes something easier" to "this can do everything."
Let me save you some time. It cannot.
The Accelevents MCP connector provides read access to event data. It can surface and summarize information, but it does not create or modify events, orders, or attendees. Access also depends on the permissions of the user connecting it, and users can control what information they share through the connector settings.
That distinction matters when you're giving an AI tool access to attendee information, payment records, sponsor performance, and other operational data.
It also helps to be specific about what you're asking. If you manage multiple events, naming the event or supplying its ID gives the AI a clearer scope and reduces the need for follow-up questions.
The AI can also only work with the systems and data available to it.
For example, your event management platform can tell you who registered, which sessions they attended, and how they engaged with sponsors. It cannot (by itself) tell you whether an attendee's company had an open opportunity, whether that opportunity accelerated after the event, or whether the account eventually became a customer.
That's CRM data.
To answer a true pipeline or revenue-influence question, your AI tool needs access to both.
That's not a limitation unique to MCP. It's part of what makes the model interesting. The long-term opportunity isn't an omniscient piece of software containing every answer. It's being able to ask a business question and let AI work across the systems where the relevant information already lives.
Your event management platform becomes one important source of that context.
How to start using AI to analyze your event data
Don't start with the most sophisticated prompt you can come up with. Start with a question that takes too long to answer.
Look for duplicate registrations before badges print. Check net revenue after refunds. See which sessions had the biggest gap between registration and attendance. Find out whether your highest-tier sponsors actually generated the most engagement.
Get an answer in a few minutes instead of spending an afternoon manually building the analysis.
Then ask the more interesting question:
What else have we stopped asking simply because getting the answer was too much work?
That's where MCP starts to change event analytics.
The next breakthrough in event reporting isn't another dashboard with more answers. It's finally being able to ask the question you have been trying to answer for years after running events.
Connect AI to your Accelevents event data
The Accelevents MCP server is included for Accelevents customers and connects your event data to Claude. Once connected, you can ask questions about registrations, attendees, ticket sales, orders, sessions, speakers, sponsors, exhibitors, venue usage, and more using natural language.
Learn how to connect Accelevents to Claude and start analyzing your event data.